Nitrate in your drinking water
Water records human impact.
Nitrate is how you read it.
Check your community water system and how it compares.
Your address matches you with your community water system. How matching works
Nitrate is a signal, not the whole picture. Low nitrate is good news, but not a clean bill of health.
Anthropogenic Nitrate in US Drinking Water — People Served, by County
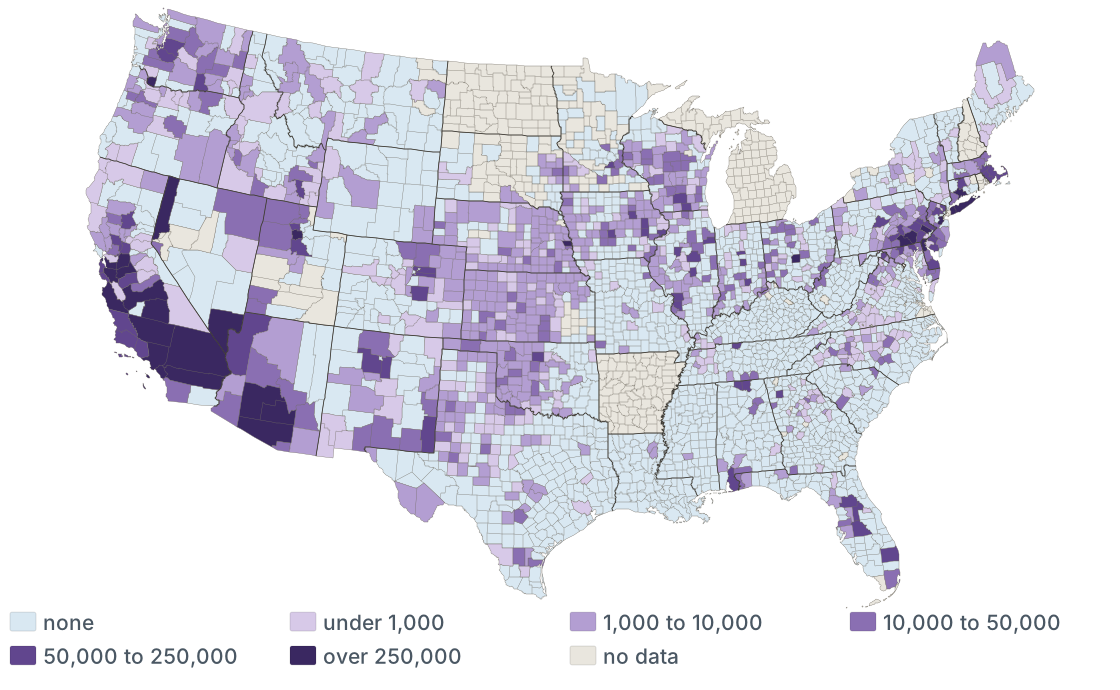
CWS customers per county on systems ≥ 3.00 mg/L as N
Based on available data through August 9, 2026, 35,908,483 Americans in 1,030 counties are being served drinking water from a community water system reporting at or above 3.00 mg/L as N — about 17.5 million of them at or above 5.00 mg/L as N, among systems matched to counties. According to the U.S. Geological Survey, nitrate at that level and above generally indicates that drinking water was impacted by nitrogen-producing human activities — mainly fertilizer, manure, septic and sewage.
| State | People served | Why it stands out |
|---|---|---|
| CA | 11,447,589 | Central Valley irrigation over coarse, well-drained ground |
| AZ | 3,165,660 | desert agriculture drawing on shallow alluvial aquifers |
| PA | 2,736,504 | dense livestock in the limestone valleys |
| NV | 2,115,604 | irrigated valleys drawing on shallow alluvial aquifers |
| OH | 1,768,746 | row crops and tile drainage |
The five largest of 47 reporting states, counted across every system in the state. Every state, and every system inside it, is on the state pages.
What the data show
- Almost every system reads below the federal limit. Of the 38,762 community water systems with a current result, 38,580 — 99.5% — read below the federal limit of 10.00 mg/L, and 27,600 of them sit within natural background.
- 36,363,494 people are served by systems reporting at or above 3.00 mg/L as N. About 17.7 million of those people are served by systems reading at or above 5.00 mg/L as N — a level health studies have used as a benchmark. For 848 of those systems, serving 980,165 people, that level has held for three years running; and 48 of those systems, serving 67,009 people, have held at or above the federal limit of 10.00 mg/L as N for the past three years, through August 9, 2026.
- Most of the 848 are small, and rural. 73% serve 500 people or fewer — the median is 200 — and more than 400 of them sit in counties of fewer than 50,000 people. 96% are on groundwater. At least 115 are mobile home parks by name, together serving about 16,000 people. Only 82 of the 848 have ion exchange or reverse osmosis on federal treatment records.
- An elevated reading — 3.00 mg/L as N and above — generally carries a human fingerprint. Somewhere uphill, human activity put nitrogen on the ground — fertilizer, manure, sewage, septic — and the water came through it. The number alone cannot name the source. What else came along — herbicides and pesticides from farm fields, or bacteria, viruses and protozoa from the digestive tract of a mammal, human or livestock — is harder to see. Nitrate is the part that can be tracked: measured almost everywhere, reported by law, and still there when the water arrives.
- Nitrate is the most mobile of the group; the rest make the trip only where the trip is quick. Fast water is karst, tile drain, sand. The defenses that strip these passengers out — binding to soil, filtering, dying off — each take time; where water moves quickly, through fractured rock, coarse ground or a shallow water table, there is less time for any of it to happen. So the conditions that carry nitrate to a supply are the same conditions under which the rest are likeliest to survive the trip.
- The fingerprint is widespread; the persistence is particular. Ohio has 1,768,746 people on systems carrying a human fingerprint — and exactly one system that has held at or above 5.00 mg/L as N for three years. Kansas has 136 such systems, Oklahoma 101. What tips the outcome is the ground — limestone valleys, tile-drained fields, irrigated sand over shallow aquifers — and what is done on it: cover crops, buffer strips, careful timing and rate help nitrogen stay where it was put.
How nitrogen reaches groundwater, and why a fast path changes what arrives →
Where to next
Where the data comes from
Nitrate in community water systems, from the utilities’ own compliance reporting.
Results reaching back to July 2023 · current through August 9, 2026.
Educational information, not medical or personal safety advice.